Claude Dashboard
Real-time Claude Code monitoring — WebSocket events, 3D canvas visualization, hook system, and full token observability.
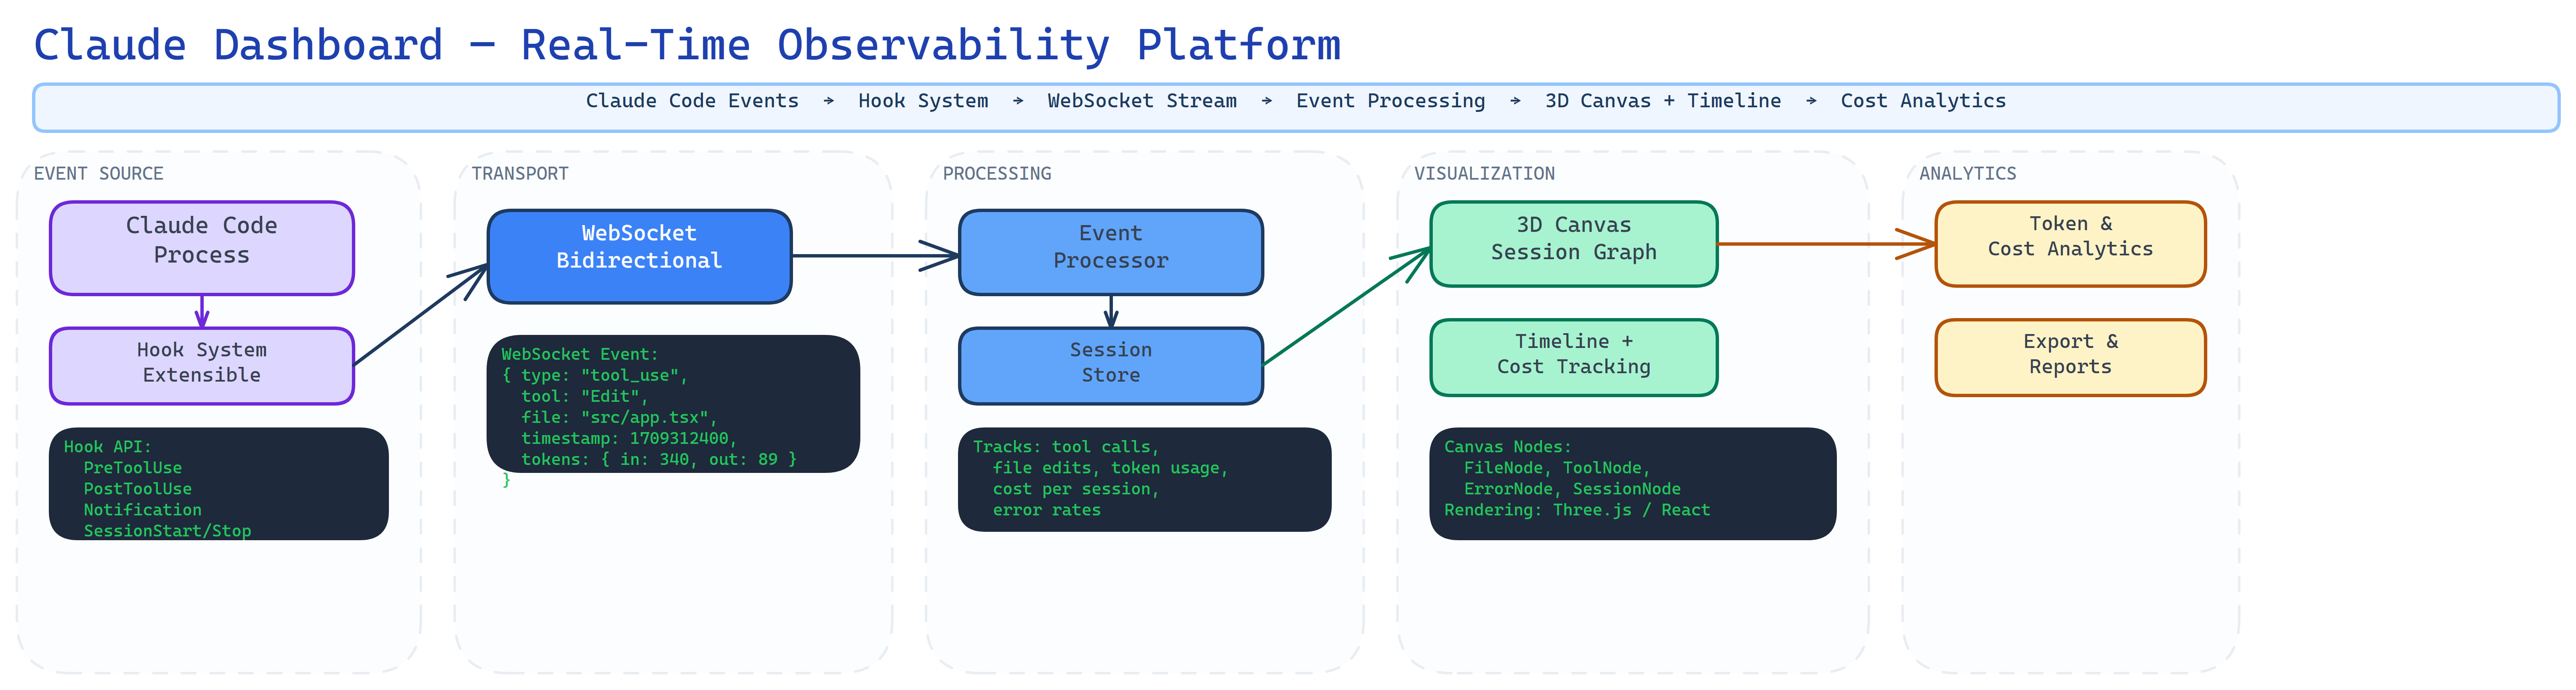
Architecture
“See everything. Miss nothing.”
The Problem
Claude Code is powerful but opaque. When you're running autonomous coding sessions, you need to see what's happening — which files are being read, what tools are called, how many tokens are consumed, and when things go sideways. Without observability, you're trusting a black box with your codebase.
The Approach
Built a real-time monitoring dashboard that hooks into Claude Code via WebSocket events. A 3D canvas visualization shows the session graph — files as nodes, tool calls as edges, time flowing left to right. A hook system intercepts events for custom processing. Token tracking shows cost-per-session with trend analysis.
Key Insight
The 3D visualization wasn't eye candy — it was the debugging tool that changed everything. When you can see the spatial pattern of a Claude session, you spot anomalies instantly: loops where the agent revisits the same files, dead ends where it reads without acting, and breakthroughs where edits cascade across the codebase. Observability is the feature.
How it works
The architecture behind the system.
WebSocket Event Stream
Real-time bidirectional connection captures every Claude Code event — tool calls, file reads, edits, completions, errors — as they happen.
3D Canvas Visualization
Session graph rendered on Canvas with file nodes, tool-call edges, and temporal flow. Zoom, pan, and inspect any node for full event details.
Hook System
Extensible hook architecture intercepts events for custom processing — logging, alerts, cost limits, auto-approval rules, and pipeline triggers.
Session Timeline
Chronological event timeline with filtering by event type, file path, and severity. Replay sessions to understand how decisions unfolded.
Token & Cost Tracking
Per-session and cumulative token usage with cost calculation. Track input vs output tokens, cache hits, and cost trends over time.
Full Observability
Every interaction logged with timestamps, duration, token counts, and result status. Export sessions for analysis or share with team members.
Built with