LLM Gateway
One API endpoint. Five providers. The gateway routes every prompt to the optimal model — balancing cost, quality, and latency in real-time.

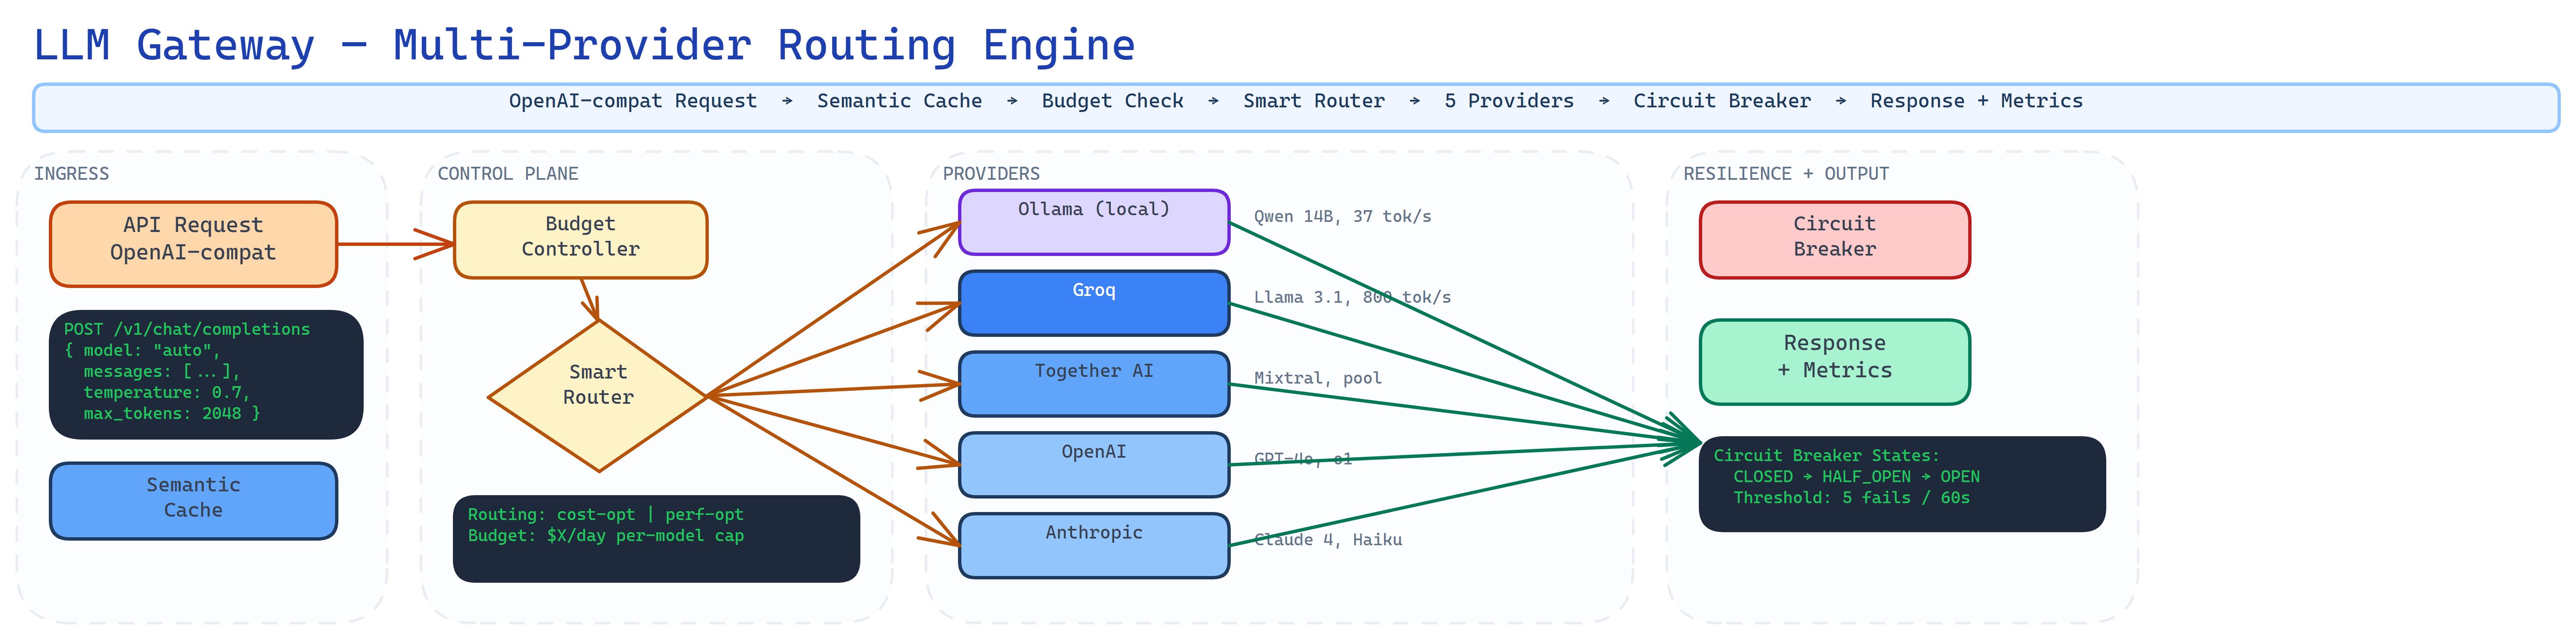
Architecture
“Why choose one LLM provider when you can have all of them — and pay less?”
The Problem
Every LLM provider has strengths. OpenAI is reliable but expensive. Groq is fast but limited. Ollama is free but local-only. Building on a single provider means accepting its weaknesses. Switching providers means rewriting every integration. The industry treats this as an either/or choice.
The Approach
LLM Gateway presents a single OpenAI-compatible API that routes prompts to the optimal provider based on complexity, cost, and latency. Virtual model names like 'auto', 'fast', 'cheap', and 'quality' let you declare intent instead of picking models. Semantic caching catches rephrased queries. Circuit breakers handle failures gracefully.
Key Insight
The real innovation isn't routing — it's the scoring function. Each provider gets a composite score weighted by cost, quality, and latency, with weights configurable per routing strategy. The system prefers local Ollama if it scores within 70% of the best option — because free inference that's 'good enough' beats expensive inference that's marginally better.
How it works
The architecture behind the system.
Intelligent Routing
Prompt complexity classifier routes to optimal provider. Four strategies — balanced, cost, quality, latency — with configurable weight sliders. Local-first preference.
Semantic Caching
Redis cosine similarity at 0.95 threshold. Catches rephrased queries without exact match. 20-40% cache hit rates reduce costs and latency dramatically.
Circuit Breakers
Per-provider state machine with automatic failover. When a provider goes down, traffic routes to alternatives with exponential backoff. Zero downtime routing.
Budget Control
Per-key monthly token and USD limits. Global budget enforcement with per-request cost tracking. Never get a surprise bill again.
14-Task Benchmarking
Standardized evaluation across Knowledge, Code, Summarization, Reasoning, and Instruction Following. Reflects real latency through your infrastructure.
Full Observability
Prometheus metrics + Grafana dashboards. 7-page dashboard with real-time latency charts, provider health, cache stats, and budget usage.
Built with